
Dr Dipon Sharmah
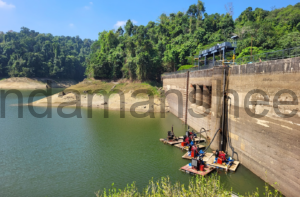
It was the month of February-March this year. One of my M.Sc. students stood at the edge of the Dhanikhari Dam with a notebook. She wrote down a number. It was the water level of the reservoir. The figure, she scribbled, was 56.49 metres. A few weeks later she finished her fieldwork. The water level had fallen further. It now read 52.8 metres. By then, the household water taps of Sri Vijaya Puram were running once every three days.
Three years ago, in July 2023, I wrote about the water crisis in these islands. The piece, titled “Parched archipelago“, was published in The Assam Tribune dated 7 July 2023. It described a capital town of over 1,50,000 people whose life depended on a single reservoir, fed by monsoon rain and not perennial rivers. It described the acute water scarcity in the islands, where water was supplied once every five days, and in some areas up to thirteen days. It was March-April of 2023. Water was brought in tankers from nearby islands like Hutbay. The piece ended with a warning that the water crisis in the islands should be tied to global weather phenomena, arguing with some hard-hitting data that El Niño steals our rain. And finally, I asked whether we were prepared for the subdued monsoons in the forthcoming years.
I did not expect that the warning would strike us so soon, and so precisely. It arrived in 2026. And it may show its full impact in the early months of 2027.
My student, Deepthi, surveyed and documented the two dams: the Dhanikhari and the Chouldari in the first few months of this year. These dams supply most of the water to the residents of the Sri Vijaya Puram. Her table of field numbers tells the story much better than any argument of mine. In March 2019, after a good Northeast monsoon (November to January) rainfall, the dam stood at 60.74 metres. In March 2020, after a failed one, it stood at 55.49. In 2021 and 2022 it stood at 62.1 and 59.5 metres. In March 2023, the year with a water crisis, the water level was at 56.28 metres. This year it is again lower. The pattern is clear. When the Northeast monsoon fails, the taps run dry in the months that follow. The dam has been displaying these warnings for years.
We have two monsoons here. The first is the Southwest monsoon. Normally, it starts in mid-May and tapers off by September. It brings a lot of rainfall and all our dams are filled. The second is the Northeast monsoon. It generally starts in November and tapers off by January. This replenishes the used water in these dams. The replenished water caters to the needs of the burgeoning city population from January to April. So, the general observation is that the Southwest monsoon does the filling. The Northeast monsoon does the topping up. In any crisis year, it is the topping up that fails.
Therefore, for us, the danger lies in the erratic Northeast monsoon and drizzle that is associated with it. Here, I am arguing that the rainfall from January to April, which is about five to six percent of our total rainfall in a normal year, is the one that keeps our dams from drying up. So water scarcity in these islands is not caused by a failure of the big monsoon. It is caused by the failure of the small rain that falls between January and April.This rainfall is just like the drip that keeps a patient alive.
Therefore, I took up the task of looking into the rainfall data from January to April since 1949. I wanted to find some sort of correlation.
In a healthy year this rain is spread across all four months. There is the January tail of the monsoon, then the February and March showers, and then the April pre-monsoon thunderstorms. It is not one month’s gift.
Let us see what the recent rainfall records of Dhanikhari Dam show. In a good year, these four months from January to April bring 240 to 550 mm of rainfall. For example, in 2021 they brought 245 mm. In 2022, 555 mm. But in 2020, only 10 mm rainfall was recorded. Again, in 2023, 13 mm was recorded in those four months. In 2024 and 2025, the rainfall recorded was 130 mm and 237 mm. And this year, 50.7 mm rainfall was recorded. The years 2020, 2023 and 2026 are our three crisis years. Water rationing was carried out in these years.
The point that I am trying to make here is this: whenever the small rain from January to April has failed, the city has suffered. Whenever this small rain came, the city was getting water every alternate day.
Now the important question is: who controls this small rain between January and April in these islands? The answer is the Pacific Ocean. It is situated thousands of kilometers away from us. Yet, it is the master.
When the Pacific passes a cool winter, a condition called La Niña, there is plenty of rainfall from January to April. When the Pacific passes a warm winter, a condition called El Niño, rainfall almost dies down from January to April. But the total annual rainfall might not be affected at all. That is why the water crisis has always surprised us!
I was convinced of this pattern. But I needed data to prove it. So I checked the rainfall record of every year since 1949. Every time our January to April rain has failed, an El Niño was there. This happened 20 times in seventy-seven years (Table 1). There was not a single false alarm. The reverse is not always true: a weak or newly forming El Niño sometimes spares us. Therefore, the January to April collapsed rainfall is a clear El Niño signature.
An El Niño is not confined to a single calendar year. It develops in May-June (the ‘onset’), peaks in November-January, and decays through the early months of the following year. So it spans two years. Therefore, in our island case we must consider two different January-April windows. The January-April at the time of El Niño birth (like early 2023 and 2026), and the January-April after an El Niño winter peak (like early 2020). So the year 2023 and 2026 are interesting cases because their dry January-April came before the official June declarations of an El Niño. The rain failed in these islands although the Pacific was still neutral. This was the puzzle that has intrigued me for quite a long time.
Table 1. The twenty collapsed springs (January-April < 60 mm), ranked driest first from 1949-2026 with the El Niño connection for each.
| Year | Jan-Apr (mm) | Annual (mm) | El Niño connection |
| 2014 | 0.4 | 2,877.0 | El Niño formed that year (scarcity year) |
| 1986 | 0.7 | 2,197.8 | El Niño formed that year |
| 1998 | 0.9 | 2,811.5 | Followed the very strong 1997-98 El Niño |
| 1980 | 8.2 | 3,756.6 | Followed an El Niño winter |
| 1983 | 8.4 | 2,975.0 | Followed the very strong 1982-83 El Niño |
| 2020 | 11.1 | 2,881.8 | Followed the 2019 warm event (scarcity year) |
| 2023 | 29.9 | 3,350.7 | El Niño formed that year (scarcity year) |
| 1964 | 22.0 | 3,323.8 | Followed a moderate El Niño winter |
| 1995 | 23.3 | 3,358.4 | Followed a moderate El Niño winter |
| 1997 | 24.2 | 2,795.8 | El Niño formed that year |
| 1957 | 29.4 | 2,898.1 | El Niño formed that year |
| 1993 | 30.8 | 2,542.9 | Followed the weak 1992-93 El Niño |
| 1958 | 33.2 | 3,151.0 | Followed the strong 1957-58 El Niño |
| 1971 | 37.1 | 2,894.5 | El Niño formed the next year (1972) |
| 2007 | 40.7 | 2,556.0 | Followed an El Niño winter |
| 1973 | 50.5 | 2,912.0 | Followed the strong 1972-73 El Niño |
| 2026 | 50.7 | ongoing | El Niño formed this year (scarcity year) |
| 1985 | 54.0 | 2,828.2 | El Niño formed the next year (1986) |
| 2005 | 55.3 | 3,773.8 | Followed an El Niño winter |
| 2013 | 56.0 | 3,406.4 | El Niño formed the next year (2014) |
(Rainfall source: Directorate of Economics and Statistics and Meteorological Department, Shadipur)
During the La Niña years, the rainfall between January to April is roughly 240-550 mm at Sri Vijaya Puram; in neutral years it averages around 177 mm; whereas in strong El Niño years, the rain tapers to 50-110 mm. That is a difference of three to eight times. In science, such clean patterns are very rare to see. Our islands have been keeping an honest diary of the Pacific Ocean for all these years. And we missed reading it!
In June, the American ocean agency NOAA announced that a new El Niño has been born in the Pacific. The driest of all categories is the January-April months after a peak El Niño event. January to April of 2020 is an example. There are extreme cases also. After the great El Niño of 1982, the January-April of 1983 gave us eight millimetres of rainfall. After the great El Niño of 1997, the January-April of 1998 gave less than one millimetre of rainfall. In 2026, we received 50 mm of rainfall in the January-April window. This year the collapse came as an El Niño is being born. Now, the post-peak window, from January to April 2027, is what awaits us.
The sea can still surprise us. Like it did with the great September rains of 2023. But a reader may ask: has not this El Niño already taken its toll? We received only 50 mm of rain from January to April. Unfortunately, the answer is that one El Niño strikes twice. The dry January-April of 2026 was the spell cast at its birth. The January-April of 2027 will be the shadow cast by its peak. And the record says the shadow is always darker than the spell.
There is a small weather bulletin box in the top right corner of the Government newspaper, The Daily Telegrams. It gives the day’s temperature, the humidity, the sunrise, and one number called the progressive total rainfall. It is all the rain that has fallen since the first of January, added up, day by day. On 20th July this year, the progressive running total read 1028 mm. In 2020 and 2023, the years Sri Vijaya Puram faced water scarcity, it read 1036 and 1010 mm of rain respectively. In 2022 it read 1466 mm. In 2024 it read 1688 mm. Last year it read 1683 mm. This year we are almost six hundred millimetres behind the same date last year.
So what is the solution to this cyclical problem tied to a global weather phenomenon? The long-term answers that I have provided in my earlier piece have not changed. We have to protect the catchments. We have to harvest rain from every large roof. Every Government building should recharge the groundwater. Equally important is to regularly repair the pipes that leak the precious rainwater that the dam has saved. There is an urgent need to bring the springs of Rutland Island fully into the supply system. Desalination is another aspect we must not overlook.
But there is one thing that costs nothing and would bring a lot of change. The level of the Dhanikhari Dam should be published every fortnight in The Daily Telegrams, next to the weather bulletin box. Let the general public be aware of it so that they also become a part of the greater water conservation efforts that the administration tries hard to achieve. The reservoir has been sending us signals for decades. It is time that we listen to it.
Tomorrow morning the little weather box will appear again in the top right corner of The Daily Telegrams. It might be that the progressive total rainfall will have moved a few millimetres. Most of us will miss it. I would ask you not to. Because the story of next summer is being written there, one day at a time. And somewhere over the Pacific, it has already been decided whether or not we will receive generous rain. Records say we might not. I would be happy if, this time, I am proven wrong by mighty nature.
Short Bio: Dr Dipon Sharmah is Assistant Professor and Head of the PG Department of Botany at Jawaharlal Nehru Rajkeeya Mahavidyalaya, Sri Vijaya Puram, A & N Islands, where he has taught since 2011. He holds a Ph.D. from Gauhati University and his research in fungal ecology has appeared in journals like Science Advances, Global Change Biology, Scientific Data etc. He regularly writes on science, nature and environment. He can be reached at sharmah.dipon@gmail.com.


